AI Playground

Campaigns Report
| Campaign | Sales | Gross | Average |
|---|---|---|---|
| AdWords | 382 | 82,672.44 | 216.42 |
| 360 | 77,061.60 | 214.06 | |
| TikTok | 315 | 66,005.10 | 209.54 |
Natural Language
1 You Ask
Use natural language to get the reporting data you want.
- Talk to the AI as if it were an experienced data analyst
- Ask the AI simple or complex reporting questions
- Generate and save report prompts for future use
2 AI Queries
AI will intuitively know what you are asking for and query your data.
- AI has query access to all of your RevCent data in BigQuery
- Detailed schemas are provided to the AI for all tables
- AI will run the correct query based on your natural language
3 View Results
AI can generate single metrics, charts, tables and much more.
- Ask for a simple metric response, such as total monthly sales
- Ask for complex reports, such as nested data and correlations
- Use the AI Playground to generate visually interactive elements
AI Playground
Generate 4 monthly charts for this year, each with pastel colors, stacked 2x2:
- A timeline chart, showing gross revenue by campaign name. Use a blue color pallete.
- A stacked bar chart, showing gross revenue by product name.
- A light blue horizontal bar chart, showing gross revenue by month.
- A timeline chart, showing tax each month. Use a light green color.
I have generated the 4 charts, each grouped by month for the current year displayed in a 2x2 layout, styled using the pastel colors you specified.
AI Assistants
Use AI automation to run queries and generate reports.
In this example, we want end of day transaction and refund reports sent to an email and Telegram channel.
AI Assistant
Trigger: Schedule
Frequency: Daily at 8pm EST
Objective:
Daily transaction and refund reports.
Instructions:
Get the sum amount and approval rate of transactions, as well as a list of all refunds, for the current day (US/Eastern). Group each by gateway, then do the following:
- Create a CSV for each report as attachments.
- Send an email to the payments department with csv's as attachments.
- Send a message to the Telegram channel with csv's zipped.
Thread Start
Trigger: Schedule
Time: 8:00pm EST
AI Generated
AI Tool Call
AI Function
Telegram
RevCent AI 8:04
Attached is today's daily report zip file containing transactions and refund CSV's.
reports.zip
SMTP Message
To: payments@mystore.com
Subject: End Of Day Reports
Attached is today's daily report CSV's for transactions and refunds.
transaction_report.csv
refund_report.csv
Pre-Built
Pre-Built
Pre-Built
Reports
RevCent continuously generates pre-built reports each time changes occur in your account, including new sales, renewals and more.
Pre-Built
All reports are generated by RevCent, allowing instant loading and quick multi metric analysis.
Popular Metrics
The most popular metrics suggested by users are calculated, compiled, saved and rendered in the UI.
Auto Updates
Each time a change occurs in your account, RevCent runs a new report, providing the most recent metrics.
Report Types
Multiple report types are available, with relevant metrics specific to each.
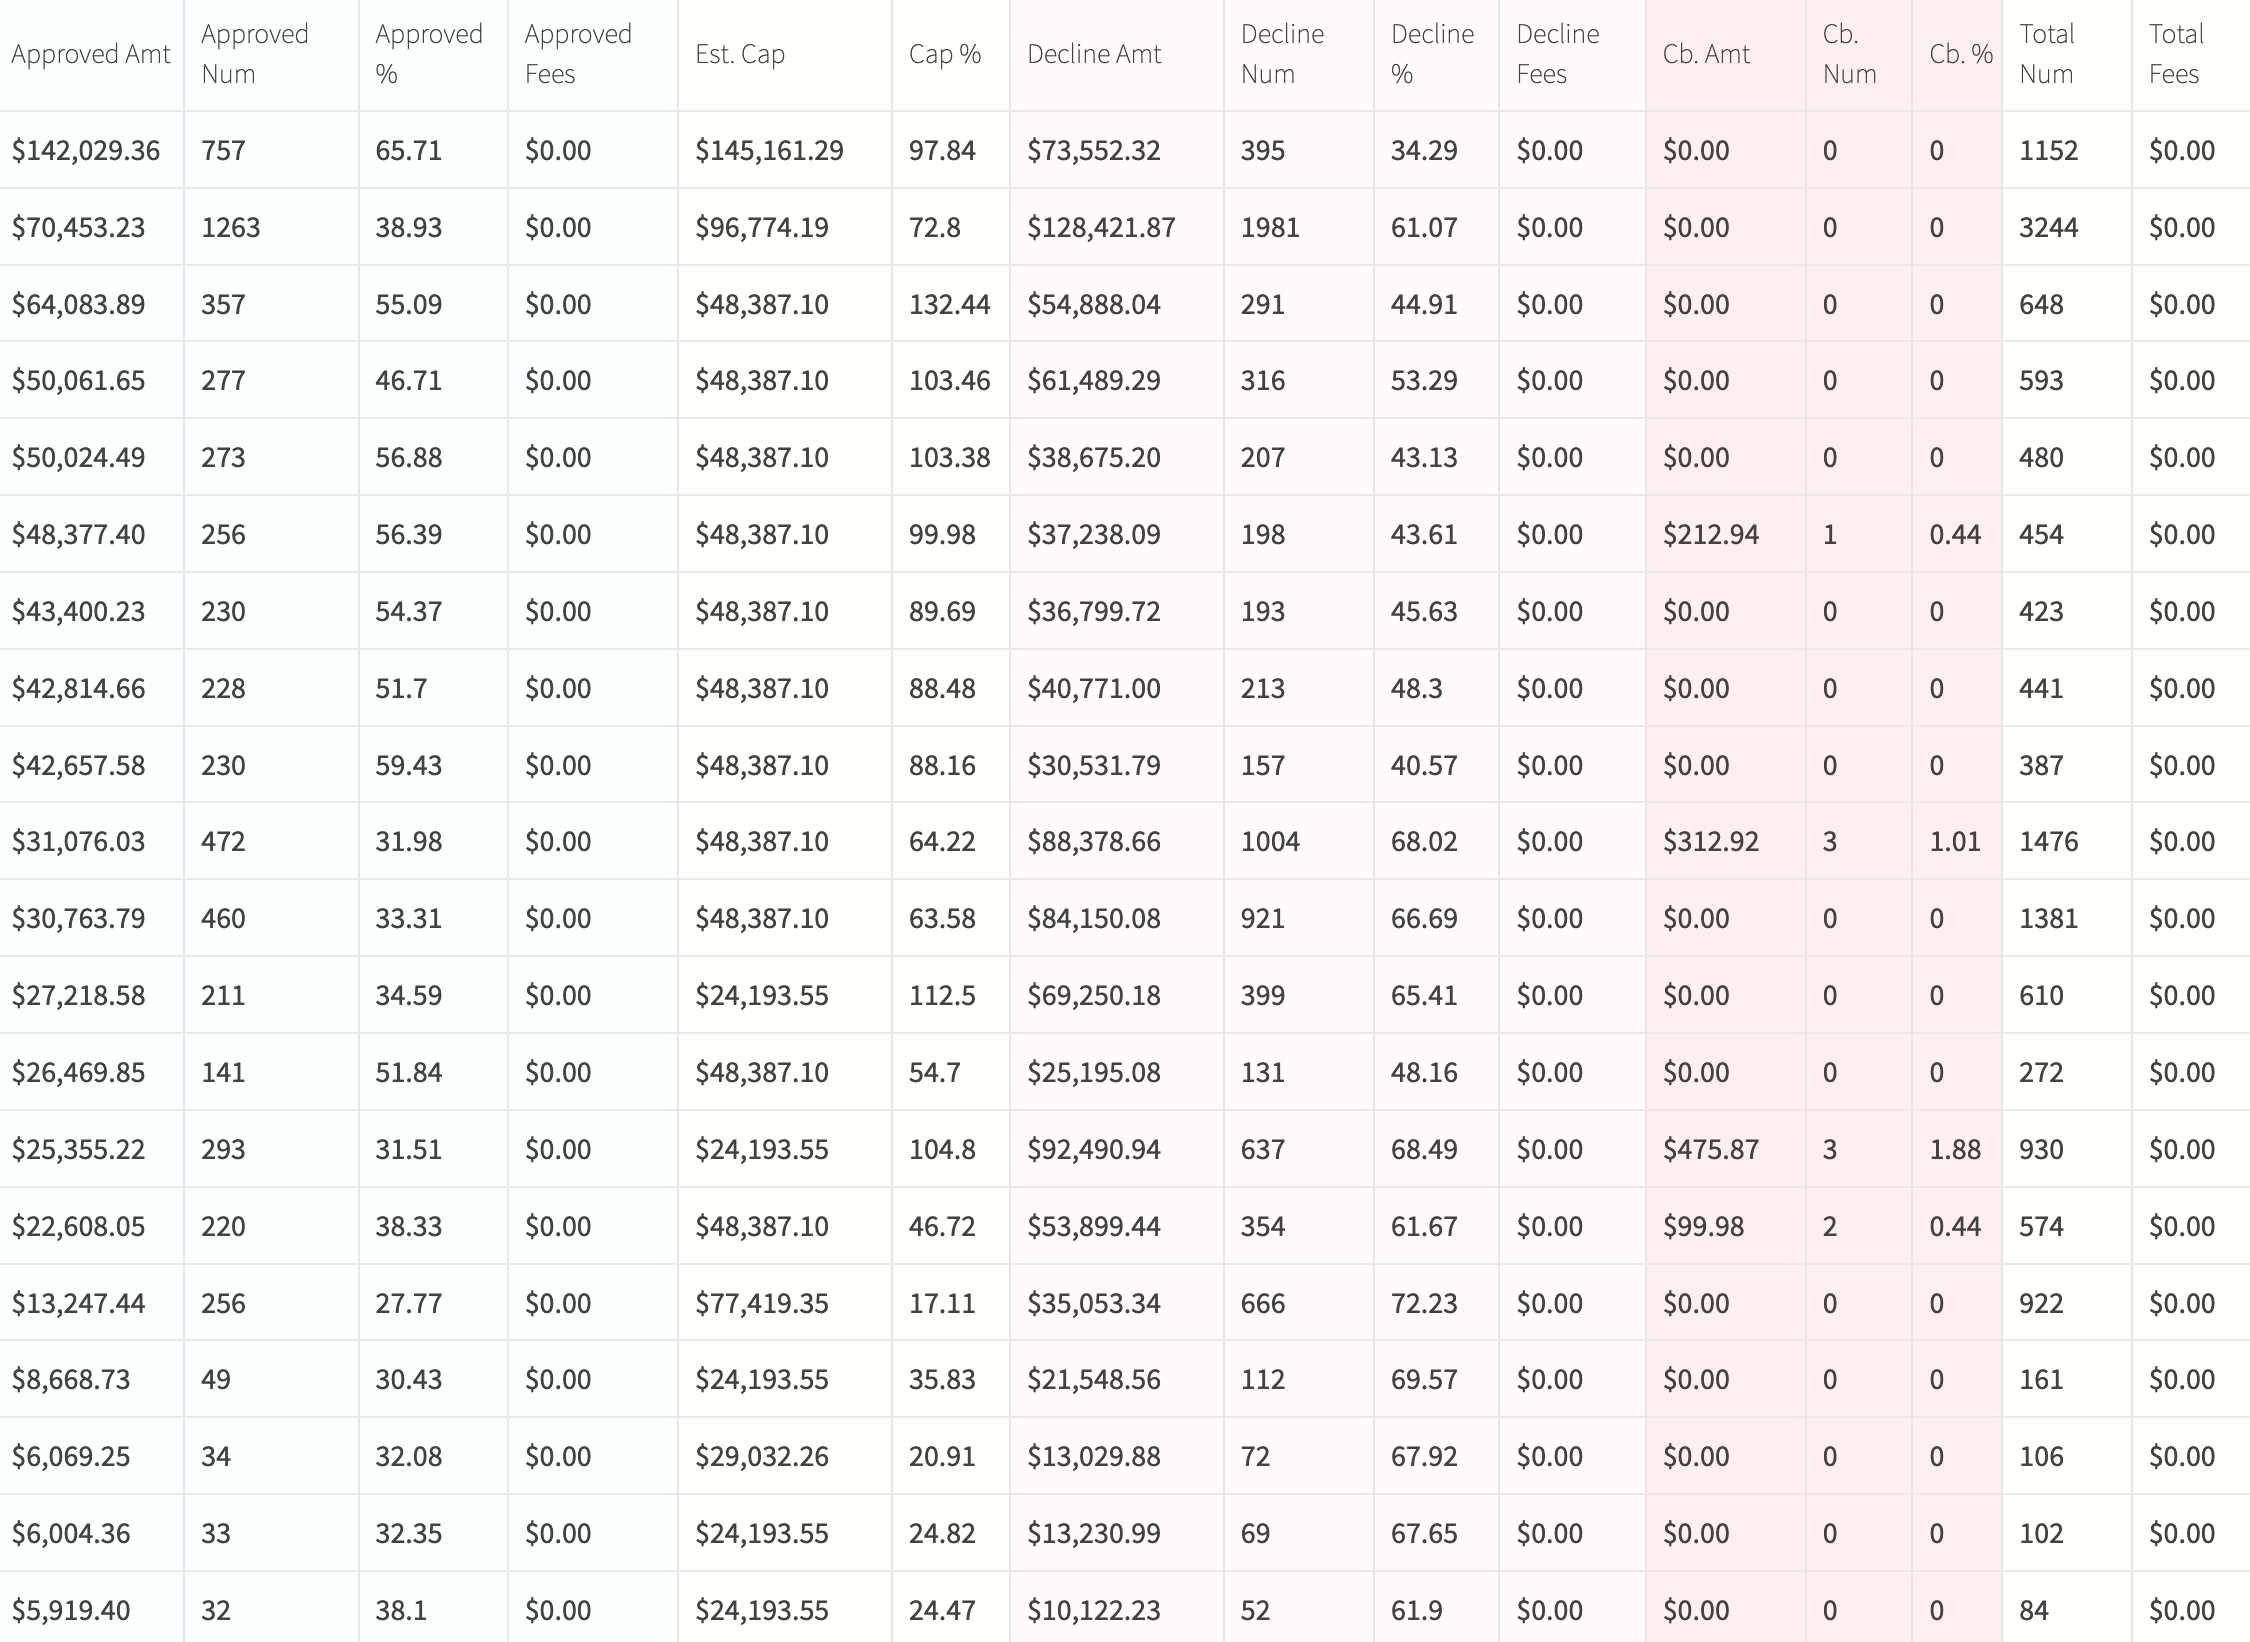
Chargeback Report
The chargeback report contains numerous metrics specific to credit card transactions that have a chargeback, including representment status.
Segments & Filters
Metrics
Customers Report
The customers report provides a broad or granular overview of all customer activity in your account.
Segments & Filters
Metrics
Fraud Report
The fraud report provides a broad or granular overview of all fraud activity in your account.
Segments & Filters
Metrics
Initial Sales Report
The initial sales report provides a broad or granular overview of all initial sales and upsells in your account.
Segments & Filters
Metrics
Payments Report
The payments report contains metrics related to credit card transactions, PayPal transactions and offline payments within your account.
Segments & Filters
Metrics
Recovery Report
The revenue recovery report provides a broad or granular overview of all recovery activity in your account.
Segments & Filters
Metrics
Subscriptions Report
The subscriptions report provides a broad or granular overview of all subscription activity in your account.
Segments & Filters
Metrics
Trials Report
The trials report provides a broad or granular overview of all trial activity in your account.
Segments & Filters
Metrics
You Create
Custom
Custom
Dashboard
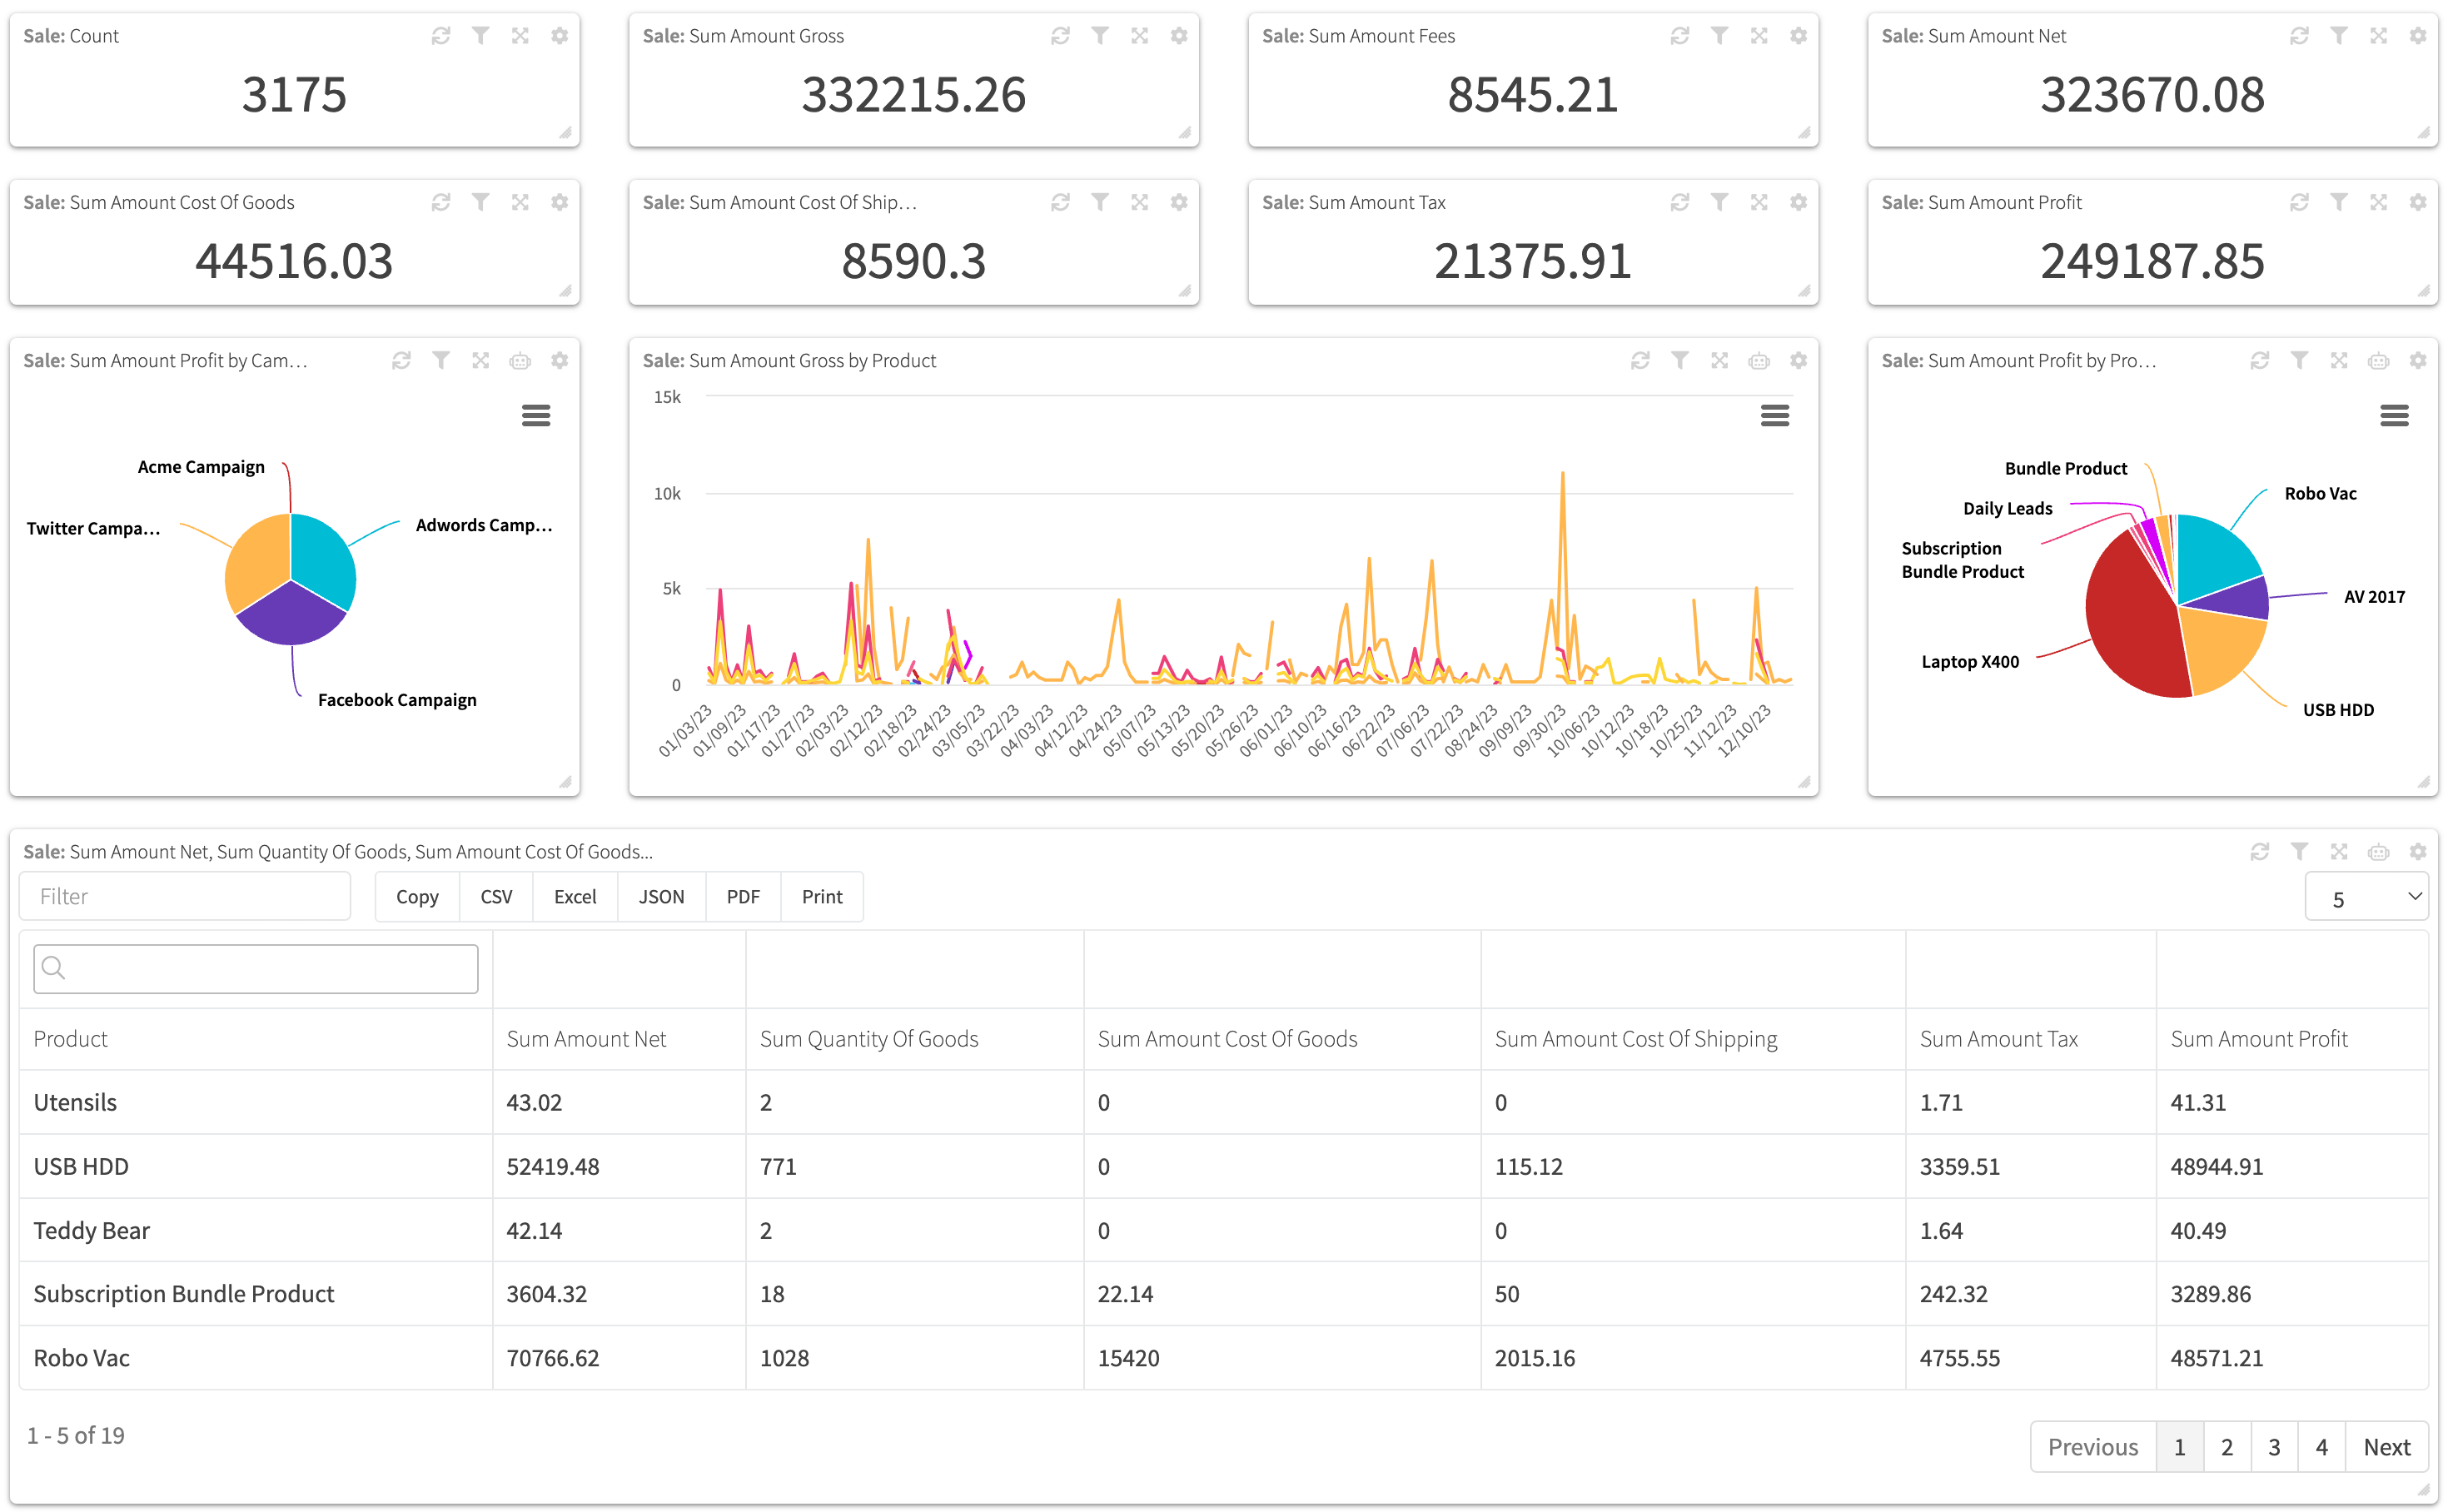
The RevCent dashboard is an extremely powerful reporting solution that enables you to create and run the exact queries you want.
Customized
You build your dashboard exactly how you want, with the specific analytics you wish to view.
Analytics
The analytics available when building your dashboard include counts, sums, averages and more.
Granular
The filtering, grouping and analytic options enables you to run the most granular reports possible.
Automated
You have the ability to have RevCent run queries at a specific frequency using the Auto Query feature.
How It Works
The custom dashboard consists of tabs and panels, each panel being specific analytic query with an element display.
Choose An Analytic
You choose an analytic for an item type, such as sum amount gross for sales.
- Numerous analytics available specific to item type.
- Aggregations include sum, average, count and percentage.
- Values include amount gross, average per item and many more.
- Certain item types have custom analytic aggregations.
Pick An Element
You choose an element for the panel which will display the final query results.
- Several elements available, with custom settings for each.
- Elements include bar charts, pie charts, tables and more.
- All elements can be exported as raw JSON, PDF's and CSV's.
- Some item types have unique elements, such as cohort charts.
Run The Query
Once a metric and element have been chosen, run the query for the panel.
- Queries are run on-demand, ensuring the latest data is used.
- All queries utilize Google Bigquery as the query engine.
- BigQuery is scalable up to petabyte sized source data.
- When the query completes, the output element is displayed.
Run SQL
Google


Google
BigQuery
RevCent stores your data within Google BigQuery for all reports, dashboard metrics and more. You have the ability to directly access your data within BigQuery via the BigQuery Access tool.
Raw Data
All of your RevCent data is securely stored within Google BigQuery, an enterprise level big data warehouse in the cloud.
Latest
RevCent immediately streams updates to BigQuery when changes occur within your account, ensuring up to date metrics.
Scalable
BigQuery was built to handle petabyte sized queries, ensuring all of your data is queryable regardless of total dataset size.
Run SQL
Run SQL queries on your raw data within the BigQuery console, via the BigQuery API or using an SDK.
Connect
Link your RevCent data within BigQuery to external tools and services for additional data analytics capabilities.
Google Sheets
Use Google Sheets to create and edit online spreadsheets. Get insights together with secure sharing from any device.
Looker
Looker is an enterprise platform for BI, data applications, and analytics that helps you explore and share insights.
Tableau
Tableau can help anyone see and understand their data. Connect to almost any database, drag and drop, and share.
Qlik
Qlik is an analytics tool that helps you use your data to solve problems, meet new objectives, and address business needs.
AdWords To BigQuery
AdWords +
AdWords +
RevCent Data
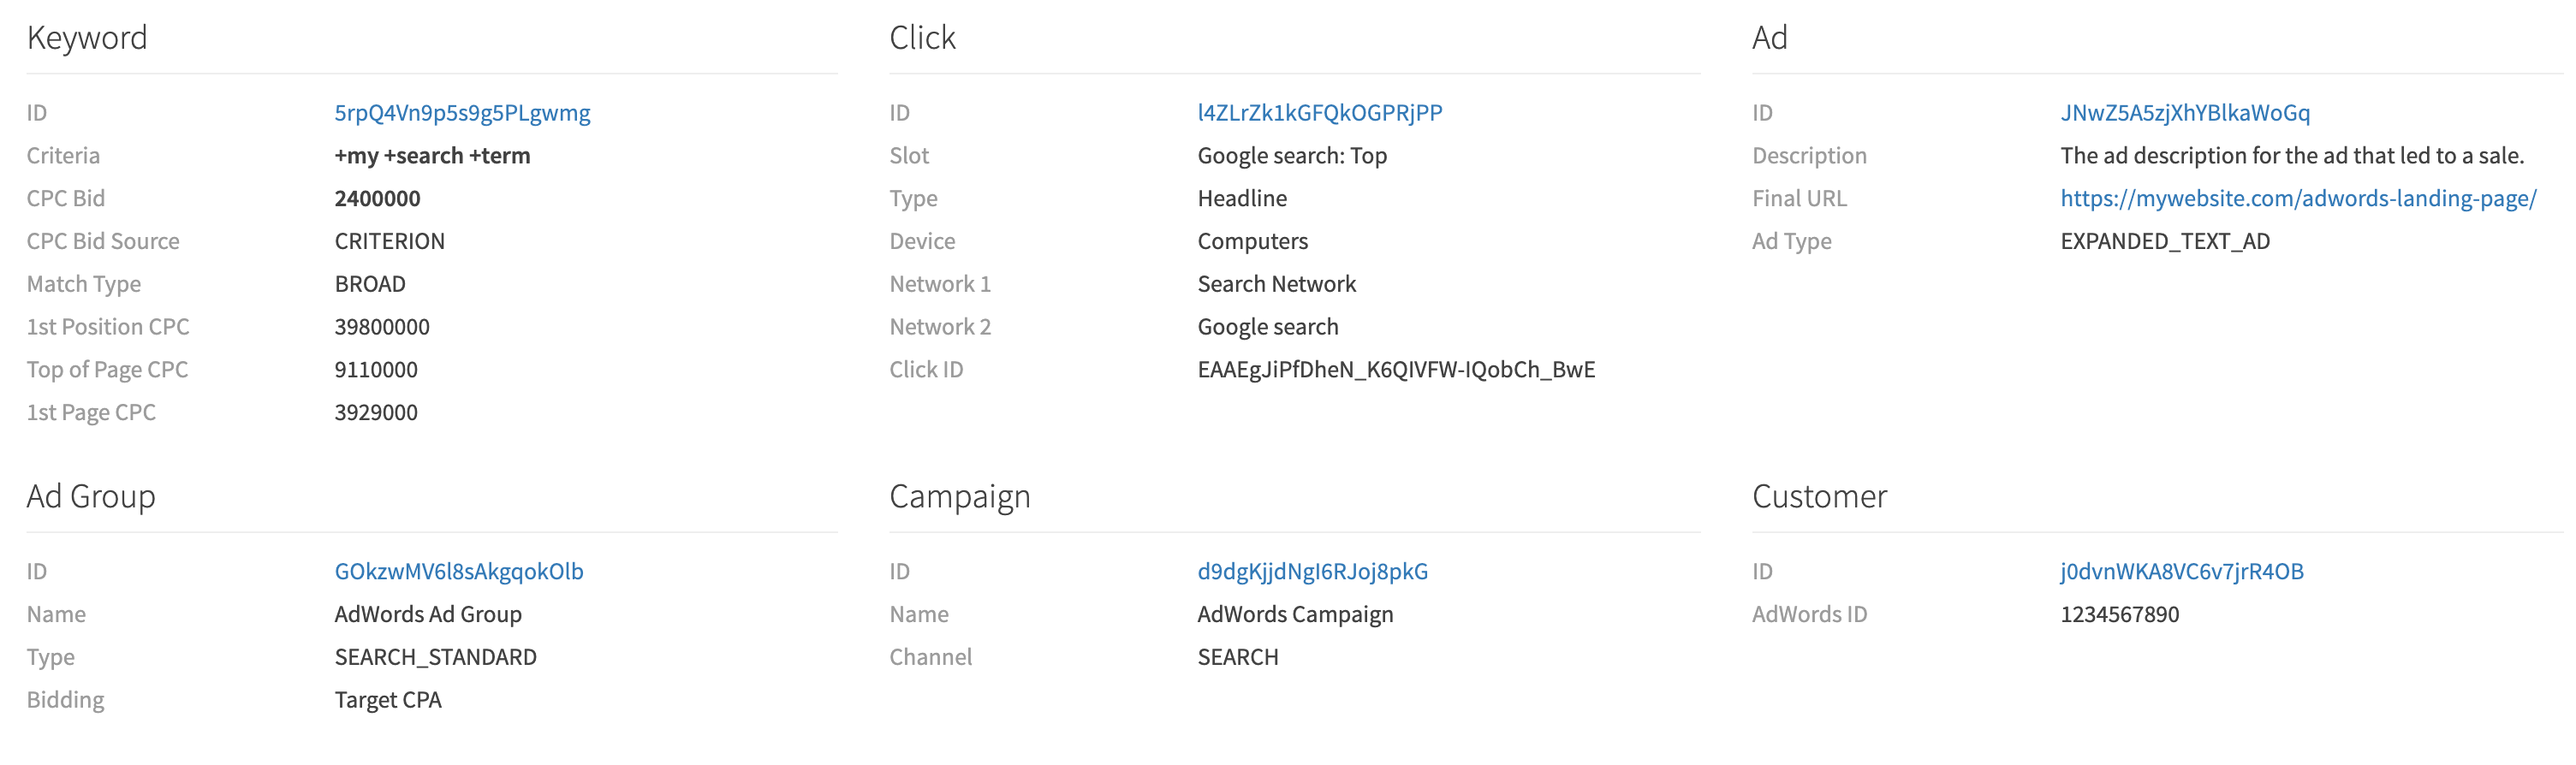
If you link your AdWords account with RevCent, all of your AdWords data can be joined with your RevCent data, giving you the most precise advertising metrics.
AdWords Data
All of your Google AdWords data is transferred to BigQuery, including detailed table views.
RevCent Join
The custom dashboard gives you the ability to query your AdWords and RevCent data as one dataset.
Managed
The AdWords data transfer service is fully managed by Google, with your datasets updated daily.
Example Metrics
Below are ways to utilize the power of being able to query your AdWords and RevCent data together.
Campaign Churn
Increase campaign spend based on the renewal rates per cycle.
- Analytic: SUM
- Value: Click Cost
- Group By: AdWords Campaign
- Element: Subscription Cohort
Keyword Profit
Discover keywords that produce the highest overall profit.
- Analytic: SUM
- Value: Sale Profit
- Group By: AdWords Keyword
- Element: Table
Network Products
Determine what products are purchased the most per network.
- Analytic: COUNT
- Value: Product Name
- Group By: AdWords Network
- Element: Pie
Audience Refunds
Identify audiences to avoid based on their overall refund rate.
- Analytic: AVG
- Value: Refund Amount
- Group By: Customer Location
- Element: Map